1 OKR examples for Survey Distribution
What are Survey Distribution OKRs?
The Objective and Key Results (OKR) framework is a simple goal-setting methodology that was introduced at Intel by Andy Grove in the 70s. It became popular after John Doerr introduced it to Google in the 90s, and it's now used by teams of all sizes to set and track ambitious goals at scale.
Creating impactful OKRs can be a daunting task, especially for newcomers. Shifting your focus from projects to outcomes is key to successful planning.
We have curated a selection of OKR examples specifically for Survey Distribution to assist you. Feel free to explore the templates below for inspiration in setting your own goals.
If you want to learn more about the framework, you can read more about the OKR meaning online.
Best practices for managing your Survey Distribution OKRs
Generally speaking, your objectives should be ambitious yet achievable, and your key results should be measurable and time-bound (using the SMART framework can be helpful). It is also recommended to list strategic initiatives under your key results, as it'll help you avoid the common mistake of listing projects in your KRs.
Here are a couple of best practices extracted from our OKR implementation guide 👇
Tip #1: Limit the number of key results
Having too many OKRs is the #1 mistake that teams make when adopting the framework. The problem with tracking too many competing goals is that it will be hard for your team to know what really matters.
We recommend having 3-4 objectives, and 3-4 key results per objective. A platform like Tability can run audits on your data to help you identify the plans that have too many goals.
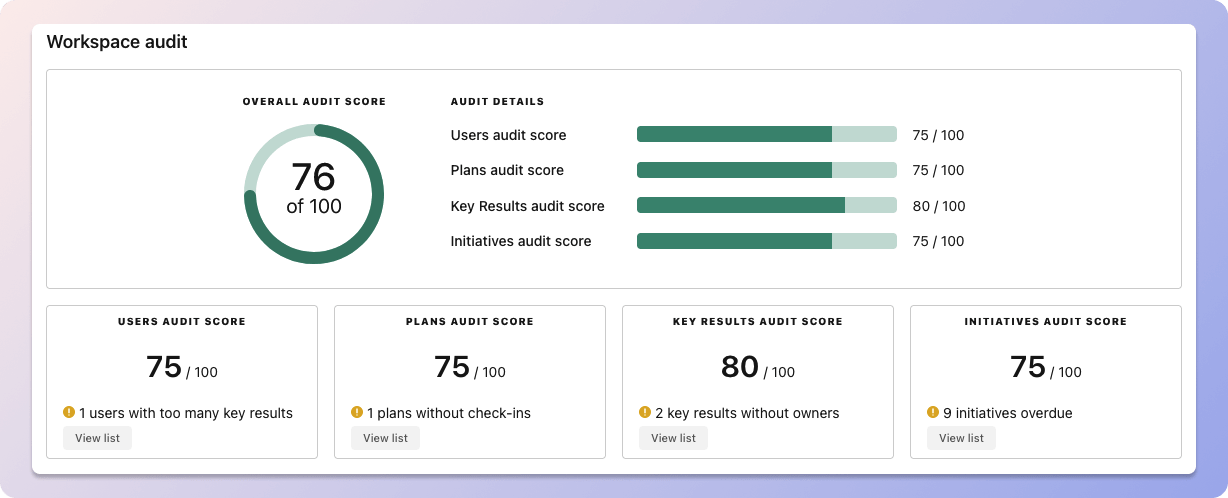 Tability's audit dashboard will highlight opportunities to improve OKRs
Tip #2: Commit to the weekly check-ins
Setting good goals can be challenging, but without regular check-ins, your team will struggle to make progress. We recommend that you track your OKRs weekly to get the full benefits from the framework.
Being able to see trends for your key results will also keep yourself honest.
 Tability's check-ins will save you hours and increase transparency
Tip #3: No more than 2 yellow statuses in a row
Yes, this is another tip for goal-tracking instead of goal-setting (but you'll get plenty of OKR examples below). But, once you have your goals defined, it will be your ability to keep the right sense of urgency that will make the difference.
As a rule of thumb, it's best to avoid having more than 2 yellow/at risk statuses in a row.
Make a call on the 3rd update. You should be either back on track, or off track. This sounds harsh but it's the best way to signal risks early enough to fix things.
Building your own Survey Distribution OKRs with AI
While we have some examples below, it's likely that you'll have specific scenarios that aren't covered here. There are 2 options available to you.
- Use our free OKRs generator
- Use Tability, a complete platform to set and track OKRs and initiatives
- including a GPT-4 powered goal generator
Best way to track your Survey Distribution OKRs
Quarterly OKRs should have weekly updates to get all the benefits from the framework. Reviewing progress periodically has several advantages:
- It brings the goals back to the top of the mind
- It will highlight poorly set OKRs
- It will surface execution risks
- It improves transparency and accountability
Spreadsheets are enough to get started. Then, once you need to scale you can use a proper OKR platform to make things easier.
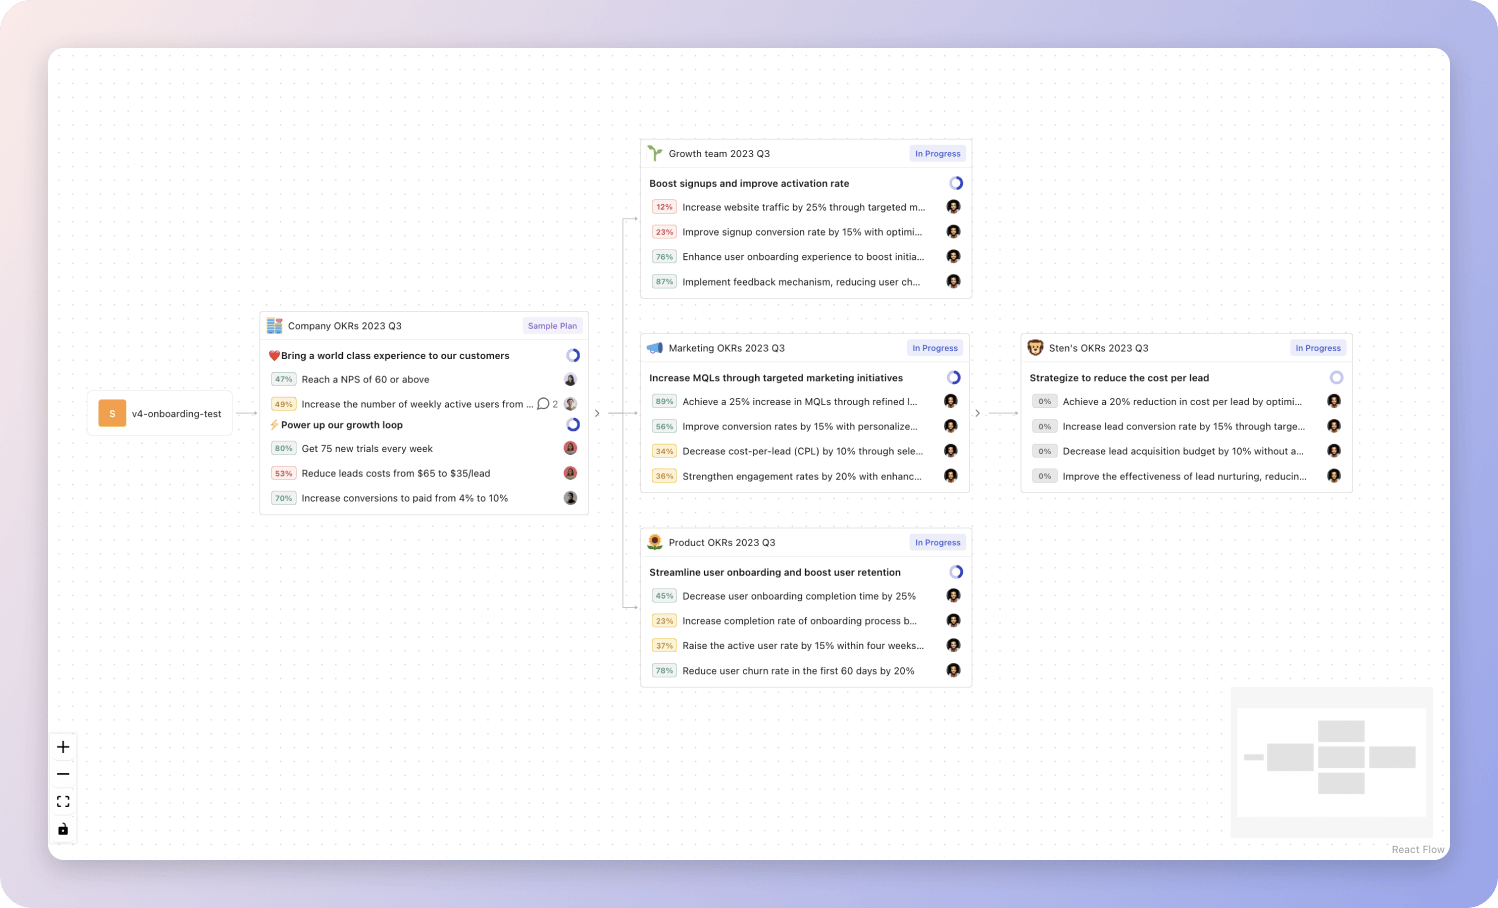 Tability's Strategy Map makes it easy to see all your org's OKRs
If you're not yet set on a tool, you can check out the 5 best OKR tracking templates guide to find the best way to monitor progress during the quarter.
Survey Distribution OKRs templates
We've covered most of the things that you need to know about setting good OKRs and tracking them effectively. It's now time to give you a series of templates that you can use for inspiration!
We've added many examples of Survey Distribution Objectives and Key Results, but we did not stop there. Understanding the difference between OKRs and projects is important, so we also added examples of strategic initiatives that relate to the OKRs.
Hope you'll find this helpful!
OKRs to establish comprehensive voice of customer reports
 Establish comprehensive voice of customer reports
 Implement changes on identified areas and achieve 20% customer approval rate increase
 Develop and implement changes based on identified areas
- Identify specific areas needing improvement through customer feedback
- Monitor and measure customer approval rate after changes
- Analyze survey responses and identify three main areas of improvement
- Compile and organize all survey responses
- Thoroughly assess each response to identify common issues
- Determine three main areas that require improvement
- Conduct surveys reaching out to 75% of our customer base for feedback
- Distribute surveys using efficient communication channels
- Identify and segment 75% of the customer base for outreach
- Determine relevant survey topics and create a comprehensive questionnaire
More Survey Distribution OKR templates
We have more templates to help you draft your team goals and OKRs.
- OKRs to elevate the quality and impact of design solutions
- OKRs to improve service recovery time in 2024
- OKRs to develop a voice-of-the-customer program
- OKRs to reduce operational cost in the Network Operations Center
- OKRs to improve writing skills
- OKRs to turn users into true fans
OKRs resources
Here are a list of resources to help you adopt the Objectives and Key Results framework.
- To learn: Complete 2024 OKR cheat sheet
- Blog posts: ODT Blog
- Success metrics: KPIs examples